
SaaS Metrics Guide: 15 KPIs To Track & Measure Growth
Wondering which SaaS metrics to track to increase profits? Many SaaS companies don’t know which metrics to track, so they take a guess and end up with irrelevant data. We‘ve put together a comprehensive guide to answer all your questions about SaaS metrics and how to improve your company’s performance.
The software-as-a-service (SaaS) industry is growing rapidly. In fact, the market is estimated to reach $219.5 billion by 2027. SaaS marketing is different from other industries, which is why it is absolutely essential to track the right metrics. SaaS metrics measure a company’s performance, growth, and momentum.
They are designed to evaluate your business’s overall health by tracking sales, marketing, and customer success. With direct access to data, you will get an idea of how your business is developing and where there’s room for improvement. This guide will cover the most important SaaS metrics for business success.
Gain clarity and grab the reins on your KPIs. Reach out to our SaaS marketing experts, today.
SaaS KPIs: Why Do They Matter?
SaaS metrics are indicators that measure growth in various ways. Just like regular KPIs, SaaS reporting helps businesses evaluate their business model and strategy. These metrics give key insights into which sectors are performing well and which require reassessment.
SaaS metrics are essential to optimizing your company’s exposure. They measure the performance of sales, marketing, and customer retention. While traditional web-based companies focus on immediate sales, SaaS companies believe in the whole customer lifecycle.
The overall goal is to build long-lasting relationships with customers because, as you will see below, most revenue is generated through recurring payments.
Get in touch with Augurian’s analytics team to discuss your KPI tracking and measurement.
SaaS Marketing Metrics
Marketing metrics can be your greatest asset if you put effort into understanding them. At first, they may seem boring and slightly tedious to track, but you’ll be rewarded for your efforts in time.
There are important and unimportant metrics. Knowing which ones to pay attention to is a challenge in itself. It is crucial to get it right because these metrics will identify your company’s strengths and weaknesses. Without them, how could you know if your marketing strategy is working?
Learn to use these first five marketing metrics to your advantage...
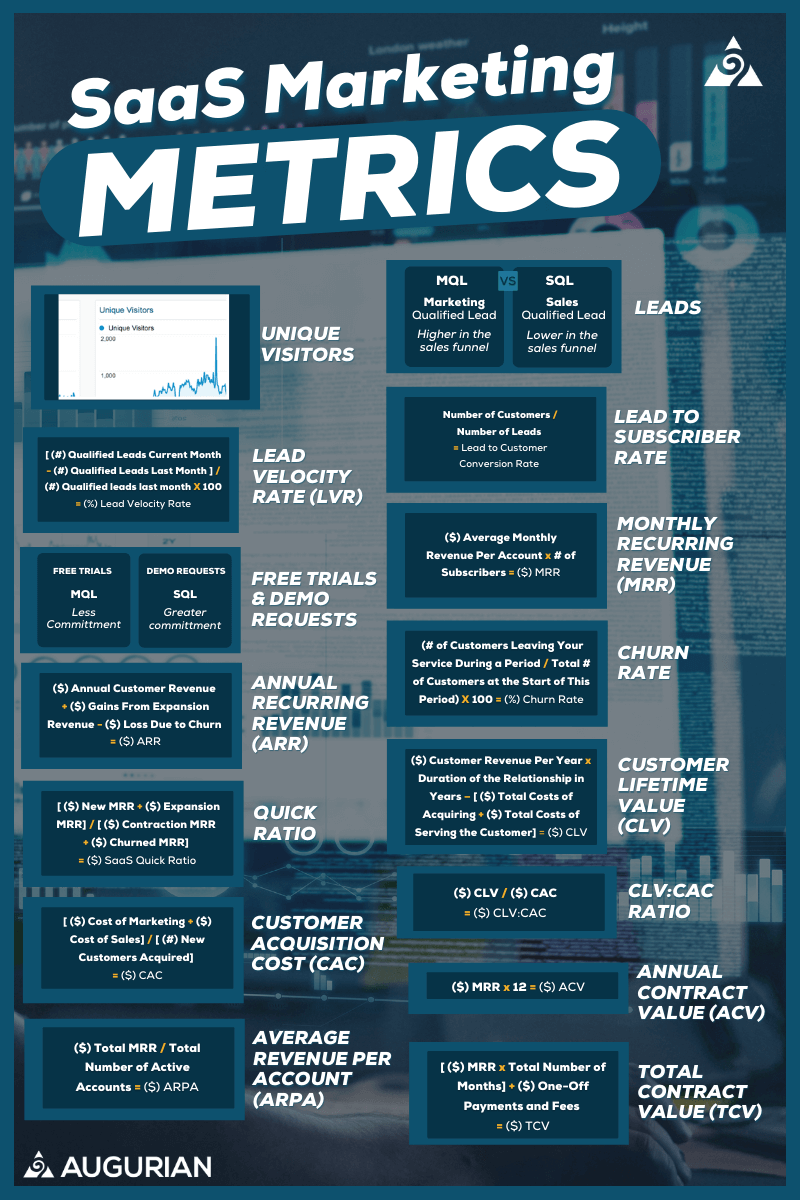
1. Unique Visitors
This metric measures the number of visitors your website or page saw in a specific time period. If somebody visited your site five times in the given time period, it would only be recorded as one unique visitor. This is an important metric as it also shows what types of visitors you receive and through which channels they arrive at your site. You can explore more insights for these users within advanced segments.
How To Measure Unique Visitors
Unique visitors are tracked by measuring the number of people who engage with your page or website over a certain period. The metric doesn’t only track how visitors reach your site but also measures how long someone is on your site and what they view.
Example: The following metric will show how many visitors your site has over a month and exactly how they got there. Let’s say that you have 62 visitors. Of those 62 visitors:
43 accessed your site directly,
12 accessed your site via organic traffic,
And 7 accessed your site via social media.
This indicates that your social media reach needs work to gain more exposure. Consider leaning into your paid social strategy to improve your reach and get more impressions from the right people.
2. Leads by Lifecycle Stage
Not all leads are the same. Some leads are more qualified than others. You must use different strategies to maximize your potential. The two main types of qualified leads are marketing qualified leads (MQLs), and sales qualified leads (SQLs).
MQLs refer to leads that are past the visitor phase. They have engaged with your site a few times and show interest in your solution by viewing pricing pages or case studies.
SQLs are lower in the sales funnel than MQLs, as they are actively engaging with your site and show sales-readiness by requesting a demo. At this stage, the appropriate step is a direct sales pitch.
You must distinguish between the two leads to identify the appropriate next steps.
How To Measure Leads by Lifecycle stage
These leads are measured by tracking the number of visits to your site per user and their level of engagement. If they have only accessed your site once and skimmed through the website for a few minutes, they would fall into the MQL category. If a specific user has requested demos or entered into a sales conversation, they fall into the SQL category.
Example: A visitor who hasn’t fully engaged with your site is an MQL candidate. Your marketing team should now reach out and discuss what the visitor is looking for. The marketing team then qualifies them as SQL. At this point, the sales team will step in and assist the visitor with purchasing your product.
3. Lead Velocity Rate (LVR)
This metric tracks the development percentage of qualified leads from month to month. This creates an overview of your business’s potential growth. LVR is used to forecast how many visitors can be converted to customers.
LVR predicts your future growth and revenue in real-time. If you hit your LVR goal every month, it will correlate directly with your company’s growth. This metric is simple to track and is crucial to success.
How To Measure Lead Velocity Rate
To calculate LVR, take the number of qualified leads from the current month and subtract the number of qualified leads from the previous month. Then divide by the number of qualified leads from the previous month and multiply by 100 to get a percentage. This is a direct comparison between how many visitors your site had last month and the current month.
Formula: [ (#) Qualified Leads Current Month - (#) Qualified Leads Last Month ] / (#) Qualified leads last month X 100 = (%) Lead Velocity Rate
Example: Plug your values into the formula for the current and past month. You will get a quick idea of how well your business is currently performing. You can change the period in which you would like to measure the number of users—for example, the first and second quarter of the year.
Gain clarity and grab the reins on your lead metrics with our SaaS marketing experts, today.
4. Lead to Subscriber
This metric measures the number of leads that are converted to customers, giving you insight into the quality of your leads. Low-quality leads generate poor conversion rates, and high-quality leads generate higher conversion rates. The metric mirrors the effect that your marketing strategy has on potential customers.
This again shows just how important marketing metrics are. Without them, you wouldn’t be able to pinpoint the areas of your business that need improvement.
How To Measure Lead to Subscriber
The formula used is a simple one—the number of customers divided by the number of quality leads. The conversion rate can be anywhere between 0 and 1. The closer your conversion rate is to 1, the better. Your company’s potential clients are the focus of this metric and will surface opportunities to get your conversion rate closer to 1 (100%).
Formula: Number of Customers / Number of Leads = Lead to Customer Conversion Rate
Example: To envision this, you can take the number of quality leads and see how many of those leads ended up buying something. If there are plenty of leads converted to customers, then you know you are doing a good job with your marketing strategy.
5. Free Trials and Demo Requests
Many SaaS models use free trials and demos to engage with potential customers. These features give people first-hand experience with your product. The trial period is free of charge and usually lasts one week. At this time, the customer can go through your product and its features.
Customers who download the free trial are seen as MQLs as it takes little commitment. Demo requests are usually qualified as SQL because greater commitment is required to sit through a demo.
How To Measure Trials and Demo Requests
You can use this metric to determine your MQLs and SQLs by providing free trials and demos to prospects. You can take the number of people who have downloaded the free trial and/or demo, qualify them, and put your sales and marketing teams into action.
Example: Prospective customers usually find your free trial on your website and can easily download it. You might include an option to switch over to a paid subscription after the trial period is over. Alternatively, you might also allow prospective clients to request a demo on your website, where they could schedule a phone call with someone from your technical sales team.
SaaS Growth Metrics
Any business owner will know that serious growth requires a solid strategy informed by clean data. SaaS growth metrics reveal your company’s momentum and performance. The following growth metrics include a number of SaaS valuation multiples and combine marketing, sales, and customer acquisition to provide you with key insights into your core processes.
Gain clarity and grab the reins on your growth metrics with our SaaS marketing experts, today.
6. Monthly Recurring Revenue (MRR)
MRR forecasts the revenue your customers provide by paying the monthly subscription fee. As we know, SaaS companies operate on a subscription basis, either yearly or monthly. The number of recurring customers every month gives a dependable idea of your company’s future revenue.
MRR is critical to understanding where your company is going. This metric is a reliable indicator of your monthly income, allowing you to plan your company budget and pitch to potential investors.
How To Measure MRR
The formula shows your total subscription revenue generated over a month. The sum of your income from subscriptions over the month gives you your MRR. To calculate this, identify the average monthly revenue per account. Then multiply that number by the number of subscribers. It’s important to note that you shouldn’t include one-time or ad hoc charges, only revenue from subscriber contracts.
Formula: ($) Average Monthly Revenue Per Account x # of Subscribers = ($) MRR
Example: You currently have two recurring customers who pay $1000 each. Your MRR would look like this:
Current month: $1000 x 2 = $2000
Next month, you pick up another three customers.
Next month: MRR = $1000 x 5 = $5000
7. Annual Recurring Revenue (ARR)
Annual recurring revenue is very similar to the monthly recurring revenue except that it is measured over the course of a year. Depending on how your subscription is run, you can make use of either MRR or ARR. If your SaaS subscription runs per month, you will most likely use MRR. If you run your SaaS subscription yearly, you will most likely use ARR to track your revenue.
How To Measure ARR
The formula requires a few pieces of information:
Total annual customer revenue
Gains from expansion
Losses due to churn
To calculate your ARR, you add annual customer revenue and gains from expansion revenue, then you subtract losses due to churn.
Formula: ($) Annual Customer Revenue + ($) Gains From Expansion Revenue - ($) Loss Due to Churn = ($) ARR
Example: Your company made $2,000,000 in customer subscriptions in 2020 and also made $1,000,000 in subscription add-ons, but lost $500,000 due to churn/customers canceling their subscriptions.
Annual Customer Revenue ($2,000,000) + Gains From Expansion Revenue ($1,000,000) – Loss Due to Churn ($500,000) = ARR ($2,500,000)
8. Churn Rate
The customer churn rate refers to the number of clients who cancel their subscriptions over a specific time. As a subscription-based company, losing customers correlates to losing money. The churn rate is an indicator that customers aren’t getting what they want from your product.
This isn’t something that you like to see, but it is a reality for SaaS companies. At this stage, it is appropriate to reach out to the customer to ask why they have canceled their subscription. Receiving this feedback will help you identify any possible problems with your product.
How To Measure Churn Rate
The formula divides the customers who canceled by the total number of customers, then multiplies that by 100 to get your churn rate percentage. This is to get an idea of how many customers you’ve lost.
Formula: (# of Customers Leaving Your Service During a Period / Total # of Customers at the Start of This Period) X 100 = (%) Churn Rate
Example: Imagine you had 50 customers at the start of January. By the end of January, you only have 46 customers. Therefore you have [(50 - 46) / 50] x 100 = 8% of customers who have canceled their subscription.
9. SaaS Quick Ratio
The SaaS quick ratio is an indication of a business’s growth efficiency. Of all the revenue metrics, this one is the most accurate in determining your company’s overall health. The main idea behind this metric is to compare the revenue growth to the revenue shrinkage over a certain time frame.
MRR growth comes in different forms, and the quick ratio is based on different categories of MRR, including:
New MRR - from new customers
Expansion MRR - current customers who upgrade
Contraction MRR - current customers who downgrade
Churned MRR - lost revenue when customers cancel
How To Measure SaaS Quick Ratio
The formula might seem slightly complicated at first, but it becomes much easier to understand when you break it down into individual components. When using the formula, take a look at the short descriptors mentioned above for each MRR type. This will help you categorize your revenue. This ratio is straightforward because it compares your monthly growth against your monthly shrinkage.
Formula: [ ($) New MRR + ($) Expansion MRR] / [ ($) Contraction MRR + ($) Churned MRR] = ($) SaaS Quick Ratio
Imagine your revenue is growing by $5,000 every month. There are many different scenarios in which this can happen.
Scenario 1: $10,000 (New and Expansion MRR) / $5000 (Contraction and Churn MRR) = 2
Scenario 2: $20,000 (New and Expansion MRR) / $15000 (Contraction and Churn MRR) = 1.33
Scenario 3: $6,000 (New and Expansion MRR) / $1000 (Contraction and Churn MRR) = 6
10. Customer Lifetime Value
Customer lifetime value measures how valuable a customer is to your business. This means that you don't only measure their value based on purchases but the overall relationship. This metric is important because it costs less to keep an existing client than it costs to acquire new clients.
This metric is related to customer acquisition cost (CAC). Through marketing, advertising, etc., your business could spend more money trying to acquire new clients who don't necessarily bring in the same amount of money. This results in lost revenue even when signing new clients. CLV looks at how much revenue a client brings in versus how much it costs to provide them your service.
How To Measure CLV
CLV is measured by identifying the points where customers bring in value and creating a system that documents the revenue brought in over a client's lifetime.
Formula: ($) Customer Revenue Per Year x Duration of the Relationship in Years – [ ($) Total Costs of Acquiring + ($) Total Costs of Serving the Customer] = ($) CLV
Example: A client brings in $500 per year. They have been a loyal client for ten years, and you want to measure how valuable they are to your company. The cost to acquire this customer was $50, and based on overheads, this customer costs $50 to serve every year.
Customers revenue per year = $500
Customer relationship duration = 10 years
Cost of acquisition = $50
Cost to serve = $50 per year ($500 over 10 years)
The calculation would look like this: $500 x 10 years - ($50 + $500) = $4,450
SaaS Sales Metrics
Are you spending too much money on your sales strategy or acquiring new customers? What are the indicators to look out for, and how do you know which customers are generating the most revenue? All these questions are answered by the metrics below.
Gain clarity and grab the reins on your sales metrics with our SaaS marketing experts, today.
11. Customer Acquisition Cost (CAC)
The customer acquisition cost aims to tell you how much you should spend to acquire a new customer. Two main factors that determine CAC are:
Lead generation costs
Cost of converting that lead into a client
CAC predicts the resources that are needed to acquire new customers. If you want to increase your customer base and still make a notable profit, it is key to understand this sales metric.
How To Measure CAC
Measure CAC by adding up the costs of sales and marketing in a given time period, then divide that value by the total number of new clients acquired in that period. This will give you insight into whether or not you are getting the most out of your marketing and sales strategy.
Formula: [ ($) Cost of Marketing + ($) Cost of Sales] / [ (#) New Customers Acquired] = ($) CAC
Example: Imagine that you spend $6,000 on marketing and $6,000 on sales per month. In this month, your company acquired eight new clients. Therefore, the calculation looks like this for the current month: CAC = ($6000 + $6000) / 8 = $1500
12. CLV:CAC Ratio
CLV and CAC go hand in hand. You need to compare the two to understand their impact on your business. The CLV:CAC ratio describes the amount of money a customer brings versus the amount they cost to acquire. The goal is to have a high CLV:CAC ratio. No company wants to lose money when bringing in customers.
SaaS analytics suggest that a healthy CLV:CAC ratio is 3:1 and that the top-performing companies have an even higher ratio of 5:1.
How To Measure CLV:CAC ratio
The way to measure the CLV:CAC ratio is simple. Take your CLV value and divide it by your CAC value to see how they compare.
Formula: ($) CLV / ($) CAC = ($) CLV:CAC
Example: If your customer’s lifetime value is $4,000 and they cost your company $1,000 to acquire, then your calculation would look like this:
CLV:CAC = $4,000 / $1,000 = 4:1
In general terms, this is a good customer to have.
13. Annual Contract Value (ACV)
This value looks at the average value of a customer over 12 months. This metric also needs to be compared to the CAC. Knowing the ACV shows how long it will take to profit from a customer. Annual contract values don’t include one-off fees.
Having customers with a high ACV isn’t necessary to build a successful company. As you may have noticed by now, the CLV, CAC, and ACV are all related. This means that you could have customers with low ACV. You will just need to sign more clients at a low cost.
How To Measure ACV
Annual contract values are measured by looking at either your MRR x 12 or if a client has a 24-month contract with you, then you can take that lump sum and divide it by 2. In basic terms, multiply or divide the value so that it covers a one-year span.
This might sound very similar to ARR, but in fact, it is calculated quite differently.
ARR vs. ACV:
ARR is the revenue that you can expect based on all yearly subscriptions
ACV is the revenue generated from individual subscriptions from each contracted customer, which is normalized across 12 months.
Formula: ($) MRR x 12 = ($) ACV OR ($) Full Contract Value / Number of Years the Contract Covers = ($) ACV
Example: Imagine a customer has committed to a 2-year contract of $10.000. This means that the customer would have an ACV of $10,000/2 = $5,000.
14. Total Contract Value (TCV)
The total contract value is measured across the entire contract length. Whether the contract spans two months or two years, the TCV looks at the total value over the given period. This includes any recurring revenue during the contract and one-off charges like onboarding costs and other professional service fees.
Note that TCV differs from CLV because it is based on contractual commitments while CLV is based on projections. Since the TCV is based on true earnings, many see it as the more accurate way to measure growth. Knowing that you will receive this value by the end of the contract allows you to plan your company expenditure.
How To Measure TCV
The TCV formula is simple and straightforward. Total the payments made towards the contract across the contract’s lifespan and add any one-off payments. If the entire contract was paid off in one payment, then it is just the total of that payment.
Formula: [ ($) MRR x Total Number of Months] + ($) One-Off Payments and Fees = ($) TCV
Example: Imagine you have a customer who commits to a 24-month contract and pays $1,400/ month. The customer also had to pay an onboarding fee of $100.
The calculation would look like this:
TCV = ($1400 x 24) + $100 = $33,700
15. Average Revenue Per Account (ARPA)
The average revenue per account indicates the revenue generated per customer account. It is also possible for one user to have multiple accounts, and thus it is important to consider all accounts.
It also reveals which products or services are performing best. ARPA covers all accounts, but it is helpful to measure both new and existing accounts separately. This gives you an idea of your customers’ revenue generation over time and whether they react to cross-selling or upselling.
How To Measure ARPA
ARPA is measured by taking your MRR and dividing it by the total number of active accounts. The resulting value is generally used to compare a business’s performance with competitors in a financial report.
Formula: ($) Total MRR / Total Number of Active Accounts = ($) ARPA
Example: Imagine your total revenue across all accounts for the current month is $80,000. The total number of accounts is 24. Your calculation would be:
ARPA = $80,000 / 24 = $3,333.33
Partner With Augurian to Develop a Data-Driven Growth Strategy for Your SaaS Company
As you have seen, tracking the right SaaS metrics will improve your business. Understanding each metric within the three categories we’ve outlined will take you one step closer to success.
Stay on top of SaaS industry news and events with our SaaS Scoop newsletter.
At Augurian, SaaS marketing is our specialty. Not only do we work with several SaaS companies already, but we’ve also built it ourselves. We know how to generate proven results every time. If you want to grow your SaaS company through smart digital in which you can have confidence, reach out to an Augur today.
Gain clarity and grab the reins on your KPIs. Reach out to our SaaS marketing experts, today.