
How To Track Quality Score Over Time With Supermetrics

One of the biggest factors in performance on your AdWords account is Quality Score.
Quality Score is defined as Google’s rating of your advertising relevance on a scale of 1-10 based on the quality of your keywords, ads & landing page. Some think that other factors such as account history may play a factor as well.
The impact of Quality Score has been researched in great detail. A higher quality score means a higher ad rank, which results in lower cost-per-clicks. It effectively allows you to get more conversions/leads/sales for your budget.
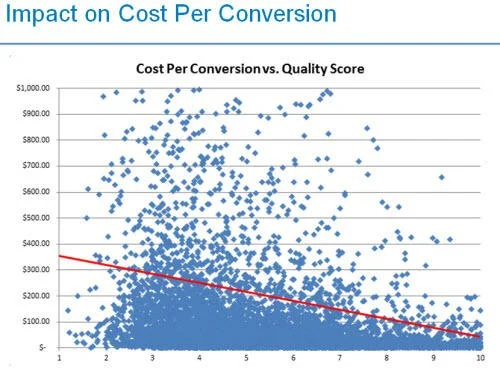
Image Source: Wordstream
The AdWords interface doesn’t easily allow you to track Quality Score. It only shows it at a keyword-level and it’s a snapshot in time as opposed to being able to see a trend. Many agencies don’t report on Quality Score, possibly because it’s hard to track.
In order for us to truly understand how our Quality Score is affecting our performance, we need to be able to see Quality Score at a campaign and account-wide level, and also see how it is trending over time.
Using Supermetrics To Pull Quality Score
The first thing you will need is a Supermetrics Pro subscription. If your agency has one (Augurian does!) then they can set the query up for you.
The next step is to create a new Google sheet for the sole purpose of tracking Quality Score. You will want separate tabs for “Account-wide” as well as individual campaigns (as shown below).

Next, you need to go under “Add-ons” in the main menu and enable Supermetrics. This will allow you to launch a sidebar right in your Google sheet where you can create and manage queries to pull data.
For your Account-Wide query, you simply want to pull “Historical Quality Score” and split it by year and month – below shows how we would pull it last year and this year to date at the monthly level.

If you wanted to pull it every day as opposed to once a month, you can change “Year & month” to “date”.
Once the query is ready, click “Get Data to Table” and it will populate the sheet.
The process to get Quality Score at the campaign-level is the same, but you need to add one step to the filter section of the query. “Campaign Name EQUALS …” (Shown below)
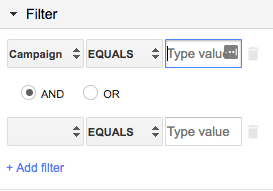
You can also group different campaigns together in logical ways with the And/Or operators.
Once you have all of your campaign-level queries finished, the back-end of your tracker is all setup.
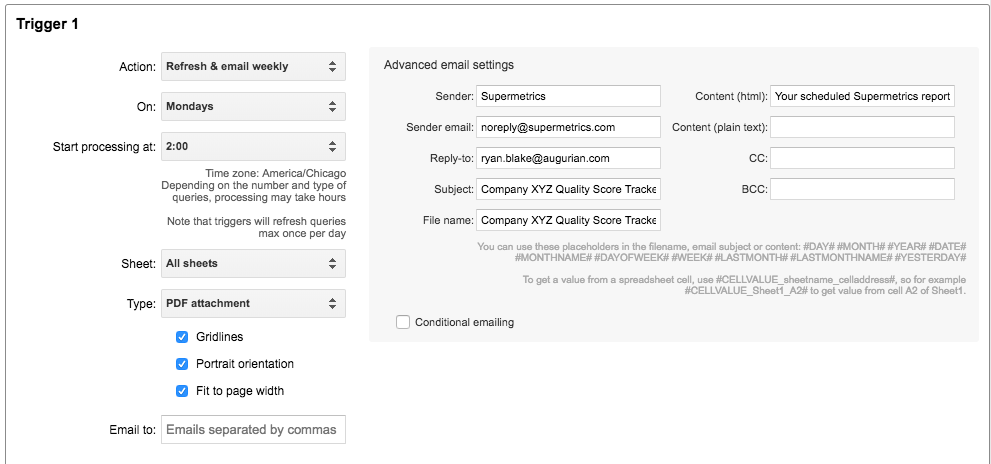
The last thing you’ll want to do is schedule automatic refreshes (Under Add-ons > Supermetrics > Schedule refresh & emailing). If you’re doing a daily tracker, you should have it refresh every morning. Otherwise, a weekly or monthly refresh is okay. You also have the option to have it send emails with the tracker attached automatically.
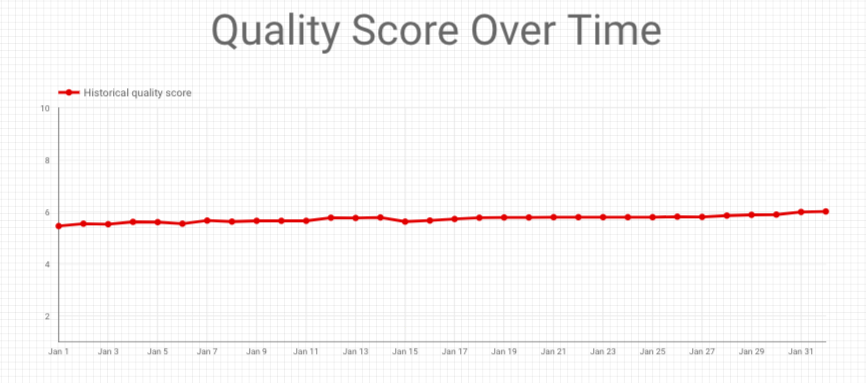
Now that the back-end of the tracker is finished, all that’s left it to visualize the data on the front-end. We use Google Data Studio (a free tool), but there are lots of tools available to do this. Here is what our finished product looks like:
UPDATE:
Supermetrics has introduced a Google Data Studio connector that will allow you to skip the back-end described here and pull your Quality Score data directly into Data Studio via an added data source (It is an additional cost).
The pros of using this connector are that it is much less work and cleaner in terms of data management. The downside is that you don’t have the data stored internally in a way that’s formatted for visualization.
If you don’t use Data Studio, or prefer to have the data stored in an internal document, you will still have to follow the steps outlined in this article.