With Cyber-Monday and the holiday retail frenzy behind us it is time to look back at your e-commerce analytics and compare 2013 to 2012. It is important to analyze this because if something worked or didn’t work you need to start developing plans and strategies for a stronger 2014.
So here is a case study of a client’s e-commerce performance and how it improved from one year to the next. The period we are comparing is (Oct 2012- Dec 2012) to (Oct 2013 – Dec 2013).
(click to enlarge graphic)
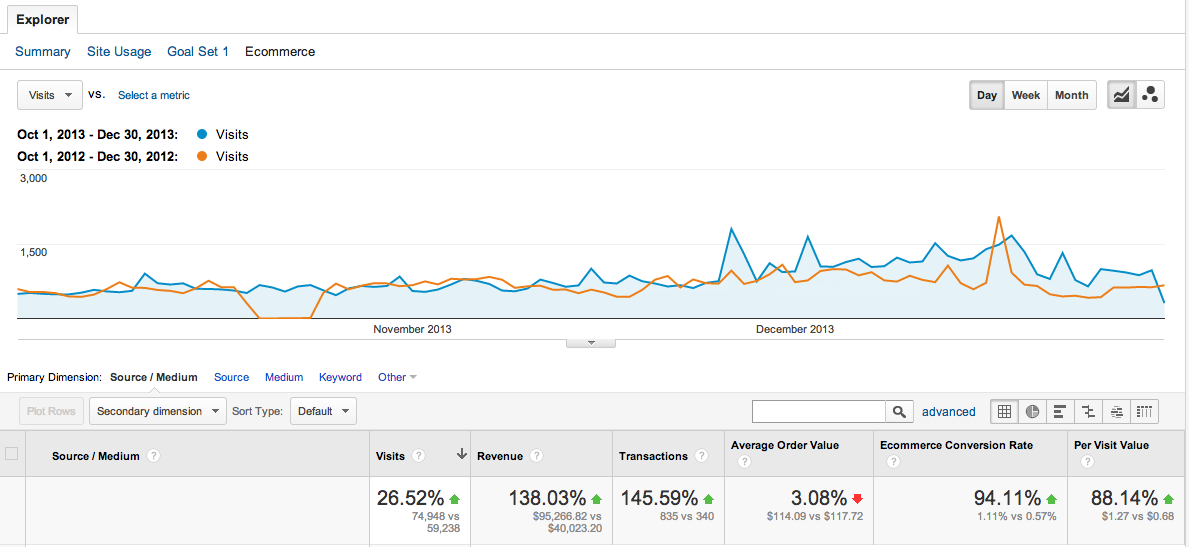
As you can see they had improved performance in almost all areas. Let’s go through these one by one:
Visits
While they show a 26% increase in visits – if you look at the overall graph you’ll see that there wasn’t an extraordinary increase by any means. But the fact that there were a lot larger increases in the other key metrics – that are a function of visits – is really important. The two key metrics i’m talking about are the E-commerce Conversion Rate and the Per Visit Value. Let’s take a look at those two.
E-commerce Conversion Rate
This went from 0.57% up to 1.11% (a 94.11% increase)! So, what is the E-Commerce Conversion Rate? Basically it is the percentage of visits that resulted in an e-commerce transaction. You calculate it by taking the number of transactions divided by the number of visits. So, getting an e-commerce conversion rate to go up while the visits go up by 26% is huge!
Per Visit Value
This went from $0.68 up to $1.27 (a 88.14% increase)! Also important because it is a function of visits. You calculate the Per Visit Value by taking the total revenue and dividing it by the number of visits.
To put a little context around these increases. What we did was optimize the conversion path for visitors by:
1) removing distractions in the cart
2) reinforcing the value proposition in the cart
3) providing larger, more colorful buttons that indicated the next click
4) focused on the channels that were delivering the most high-quality traffic and divesting in channels that weren’t driving conversions
The results speak for themselves: 146% increase in transactions and 138% increase in revenue as compared to last year!
Now, how important is figuring out what channels deliver the best visitors? Well, in this case. Their Cost-Per-Click (CPC) campaign was underperforming and their e-mail responses were outstanding at delivering consistent revenue. So we helped the client develop ways to capture more email addresses from highly qualified consumers and we helped tweak their CPC campaign. Here is how the results of these changes effected the overall results:
(click to enlarge graphic)
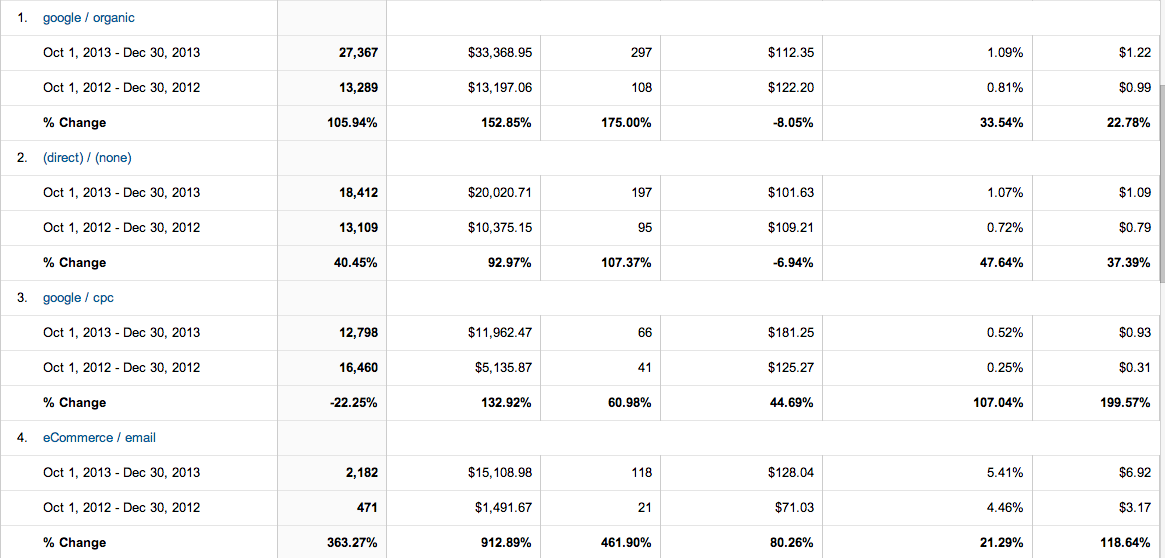
The focus on email paid off in a big way driving TEN TIMES more revenue than in 2012 ($15,108.98 in 2013 vs. $1,491.67 in 2012). In the case of the CPC campaign we saw 22% less clicks (so they paid less) while more than doubling the revenue from this source ($11,963.47 in 2013 vs. $5,135.87 in 2012) and the Per Visit Value tripled ($0.31 in 2012 increased to $0.93 in 2013).
This is just the tip of the iceberg when it comes to e-commerce analytics analysis, but I hope it has given you some insights into what to be tracking and what really matters when it comes to e-commerce analytics. If you ever want to talk e-commerce analytics just give our team at Monkey Island a shout!

- A Complete Guide To Promo Parity - January 23, 2026
- The Mom Test and Sparking Behavior Change: ‘How I Work’ EP16 with Sean Higgins (BetterYou) - February 7, 2022
- ‘How I Work’ Ep 15 with Ryan Truax - November 4, 2021